The little cherry and X-disease outbreak has become a singular threat to the PNW cherry industry, causing the removal of over 1000 acres during 2015 – 2020. (Molnar at al., 2022. J. Ext. In press). The causal agents of the diseases are different, with Little Cherry Disease caused by Little cherry virus-1 or Little cherry virus-2, and X-disease caused by Candidatus phytoplasma pruni, a bacteria commonly known as X-disease or Western-X phytoplasma. Both viral and phytoplasma-induced infection results in smaller, pale, poor-tasting fruit. Unfortunately, the fruit symptoms induced by these pathogens look very similar to the untrained eye (and regularly fool the trained eye) especially in the early stage of infection. Testing is the only way to determine the presence of infection.
As the cherry growers scout their commercial orchards for X-disease/Little cherry disease symptoms and collect samples for diagnostic testing at or around harvest here are few things to consider as they read their testing results.
Understanding qPCR results
qPCR (quantitative Polymerase Chain Reaction), also known as real-time PCR or quantitative PCR is a technique that can amplify and detect changes in DNA concentration from your sample. qPCR collects data during amplification by fluorescence signal emitted by special probes or DNA binding dyes and is used to quantify viral and bacterial loads in your sample. As data is collected, the software shows an amplification plot which is a graph with the fluorescence signal against the cycle number (Figure 1).

The Cq value (also called a Ct or Cp value) is the number of cycles needed for the fluorescence signal of a given sample to reach the defined quantification threshold. These values are inversely proportional to the amount of either virus or phytoplasma in the sample, so a high Cq value (e.g., >32 cycles) indicates a low concentration of virus/phytoplasma in the sample, and a low Cq value (e.g., <20 cycles) indicates a high concentration of the pathogen present.
What do these Cq values mean in terms of X-disease/Little cherry disease management?
It is important to note that both X- and little cherry diseases progress very slowly, over the course of several seasons. Symptoms may appear first on one fruit cluster, and spread systemically throughout the tree over time. Early infection is characterized by low number of virus or phytoplasma present, and scattered spatial distribution in the tree, with accumulation in the roots and lower trunk and limbs.
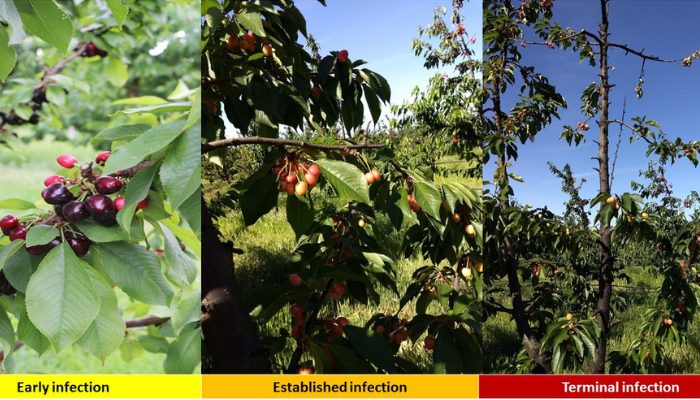
Over time, the disease becomes more and more severe in an infected tree (Figure 2), as the virus or phytoplasma concentration increases.

Figure 2. X-disease and Little Cherry Disease progression over time.
Both X- and little cherry induced symptom severity correlates with the amount of phytoplasma, or virus present in the sample. When the growers receive their diagnostic test from the laboratory, they need to pay attention to the Cq values reported. If the Cq values show >36 or negative it might be good to keep an eye on those trees in the following year. When the results fall between a Cq of 29 to 35, the infection is in the early stages with >10 virus particles or phytoplasma cells in the sample. These trees were likely infected for one year at least, with potential appearance of mild, scattered symptoms. Growers should at very least monitor spread, though tree removal is recommended. When the results fall between a Cq of 22 to 28, or worse, less than 21 cycles, the infection has become established and is accumulating, with between 1000 to 800,000 virus particles or phytoplasma cells in the sample. Symptoms are, or soon will become severe and growers must consider removing trees to prevent insect vectors from acquiring and spreading the pathogens. Table 1 summarizes the ranges.
vectors from acquiring and spreading the pathogens. Table 1 summarizes the ranges.
Table 1. Sweet cherry pathogen concentration versus symptoms
| Disease | PCR Result Range | Number of virus particles or phytoplasma cells present | Recommendation |
|---|---|---|---|
| No symptoms / Asymptomatic | Negative to 36 | 0 to 8 | Observe |
| Mild Symptoms / Early Infection Stage | 29 to 35 | 10 to 800 | Monitor spread |
| Moderate Symptoms / Established Infection | 22 to 28 | 1,500 to 85,000 | Serious risk – Remove trees |
| Severe Symptoms / Terminal Infection | 18 to 23 | 40,000 to 830,000 | Serious risk – Remove trees |
Conclusion
Cq values from diagnostic testing are a useful tool to understand how much pathogen is present in your sample, but growers shouldn’t discount the risk from high Cq/low pathogen concentrations. The pathogens will continue to accumulate in the tree, and symptoms will continue to get more severe. Worst of all, as time passes, the risk of an insect vector acquiring and spreading the phytoplasma from the infected tree to neighboring trees and orchards increases.

Scott Harper
Assistant Professor
WSU Department of Plant Pathology
May 3, 2022. Updated June 2, 2023. Summary by Corina Serban, WSU Extension.
