We are already beginning to delve further into this new year, and for the northern hemisphere, that means one thing: irrigation season is approaching. Taking care of techniques and having a plan will be essential for the management and care of our cherry trees.
The management of irrigation water has been primarily characterized as a basic strategy for the optimal development of orchards, explained through the balance provided by various parameters such as daily evaporation, crop coefficient (Kc), soil pit inspections, and other measurement instruments that support the timing and frequency strategy of irrigation in an orchard.
When there is low water availability, the development of roots is affected, which is a very important structure for the beginning of spring and post-harvest. On the other hand, excess moisture in the root can cause low growth, understanding that the crop develops better in well-oxygenated soil, as well as causing or being the cause of some fungal diseases.
“In recent seasons, as the Avium team, we have conducted research to improve certain chemical and physical aspects of the soil, measuring root growth and quality, among other parameters, in different types of projects in orchards in establishment, training, and full production. During these studies, it has been found that plants that have had excess moisture in their roots have shown suboptimal development, a situation that we see repeated every season; however, those roots that have had soil with a low minimum moisture level have also been affected their root system against this condition,” said Carlos Tapia, technical director of Avium.
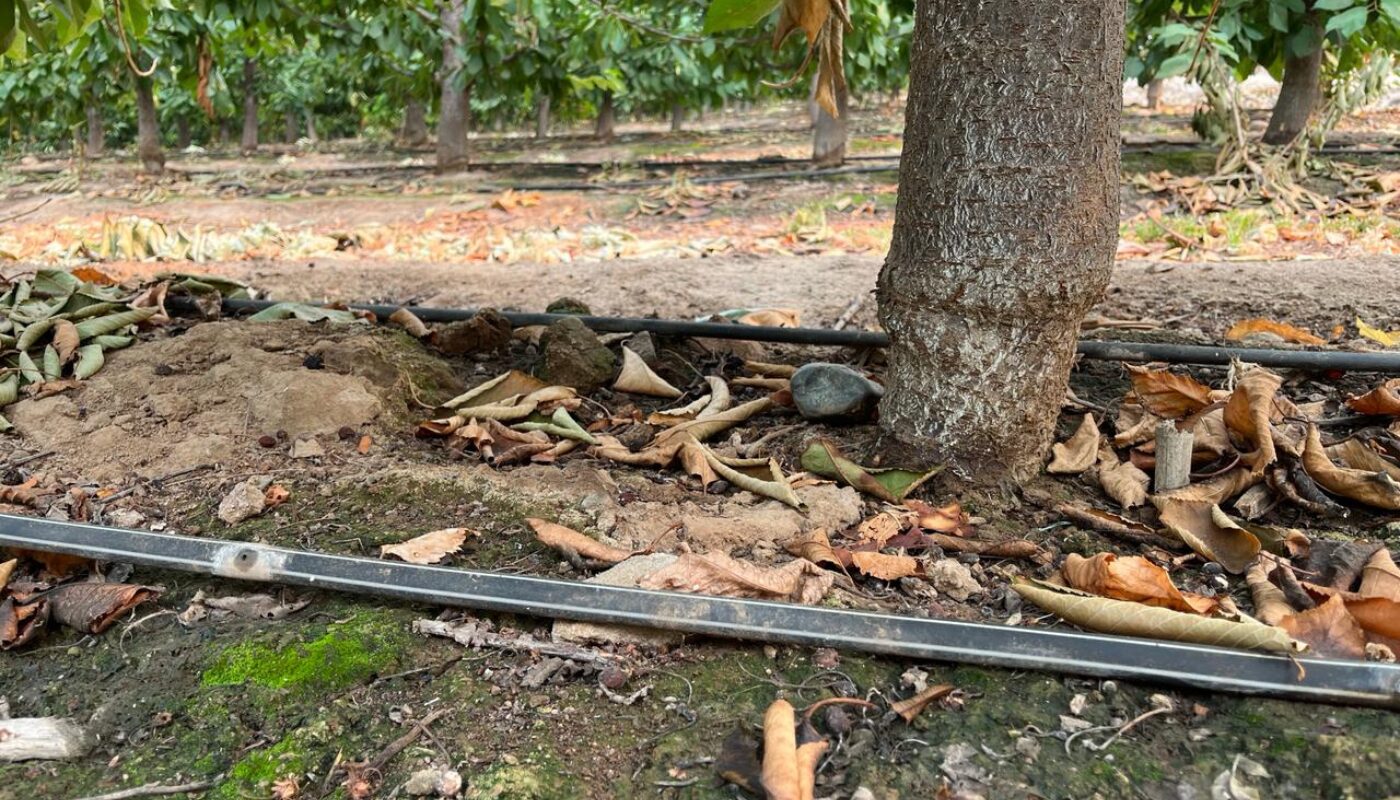
One of the factors to establish the irrigation time in a cherry plantation is the flow rate of the emitters (defined by the system manufacturer); however, this indicator can be affected by different factors (pressure, temperature, obstructions, or design failures). Therefore, the flow rate provided by the manufacturer differs in most cases from what actually happens in the orchard.
To define the irrigation time seeking to meet the gross demand of the crop, it is important to know the crop demand (Kc), flow rate delivered per plant (L/hr), and equipment precipitation (mm/hr).
From the above, the following emerges:
Determination of Irrigation Time:

Gross Crop Demand:

Where:
ETo: Reference Evapotranspiration.
Kc: Crop Coefficient.
Emitter Eff.: Typically, 90% efficiency is used for drip irrigation and 75% for micro-sprinklers.
CU: Coefficient of Uniformity.
Here lies the importance of the uniformity coefficient (CU) in determining irrigation time and its quality. It is crucial to determine if the system exhibits non-uniformity in water delivery, with some plants potentially receiving too little or too much water. This uneven distribution can lead to undesirable physiological responses from the plants and consequently affect production. It’s important to note that this determination of irrigation time does not consider soil texture.
Determination of Equipment Precipitation:

Pe: Equipment precipitation (mm/hr)
Qp: Flow rate per plant (L/hr)
Mp: Plant spacing (m^2)
Calculation of the flow rate per plant (L/hr)

Where:
Qp: Flow rate per plant (L/hr)
Qe: Flow rate of the emitter (L/hr)
Ne: Number of emitters per plant.
Building upon the previous points and from a nutritional standpoint, ensuring proper uniformity in irrigation for the transport of nutrients via water to the plant and their distribution to different organs is essential. This is crucial for supplying the necessary fertilization and the appropriate amount of water to each plant.
Periodic review of the irrigation system’s operation should be an indispensable practice to ensure the production of suitable export fruit (among other factors), both in quality and condition. Monitoring the discharge volume of the emitters and the pressure at which the equipment operates will allow for necessary corrections to the irrigation system.
To calculate the CU, samples of actual flow rates must be obtained to verify the system’s irrigation uniformity. This should be done as follows:
- Select the irrigation sector to sample.
- Within the chosen irrigation sector, select 4 rows and 4 emitters per row, trying to cover the entire sector.
- For each selected emitter, measure the volume of water delivered into a graduated container (as accurately as possible) over a specified period of time.

Example: Sampling Time: (60 seconds)
Unit of measurement for samples: cubic centimeters (cc)
Data:


Result:
The average (Q) emitter precipitation is 73.73 cc. in a time of 60 seconds.
- To convert the average cubic centimeters per minute (cc/min) to liters per hour (L/hr), the following operation should be performed:

The average as calculated in the previous step is 73.75 cc/min.

The result is that the average precipitation of the emitters is 4.6 liters of water per hour.
Once the data obtained from the samples are sorted from highest to lowest, the 4 lowest flow rates obtained should be separated to calculate the average of the lowest flow rates.

Once the values of both the average of samples (Q) and the average of the lowest flow rates (Q25) are obtained, the uniformity coefficient (CU) of the sampled irrigation system can be calculated.
To obtain the uniformity coefficient, which indicates how uniform the water supply is in the irrigation sector, the following steps should be followed:

The example showed that the irrigation system has a uniformity of 91.5%. This data, when verified against uniformity ranges, yields a result of “GOOD”.

It’s recommended that the uniformity coefficient never be less than 90%. For ranges lower than this, it’s necessary to gather information about the irrigation system to detect any faults.
During periods of heavy irrigation system use, which typically occurs from spring to early fall, it’s ideal to conduct a minimum of 3 (1 at the end of the season) CU measurements for each irrigation sector. This helps identify and correct potential modifications of flow rates, which may be caused by system failures such as emitter clogging, valve failure, invisible leaks in main and sub-main lines, filter malfunctions, etc.
Once the irrigation season is over, these collected data, along with observations of the system’s operation, will help in deciding and planning maintenance and improvements before the next season begins.