Effective Pollination Period (EPP)
The effective pollination period (EPP) is defined as the number of days during which pollination can result in fertilization and, therefore, fruit formation (Williams 1965; Sanzol and Herrero, 2001). In other words, it corresponds to the difference between the longevity of the ovules and the time it takes for the pollen tube to reach and fertilize them.
The EPP is strongly influenced by seasonal climatic conditions and depends on three fundamental processes: stigmatic receptivity, pollen tube growth kinetics, and ovule viability.
Lower temperatures, although they increase the EPP by decreasing the pollen tube growth rate, do not ensure good fruit set (relative to each variety/rootstock). This is because in cherry, fruit set directly depends on the activity of pollinators. This is noted by Sagredo et al. (2017), who found a significant decrease in fruit set when comparing different seasons, associated with average temperatures below 10°C and rainfall events during the flowering period.
Similarly, in the case of self-incompatible varieties, it is important to ensure floral synchrony with their respective pollinators.
Low temperatures affect floral receptivity, causing slowed pollen tube growth, anther dehiscence, and ovule degeneration. This is also demonstrated by studies conducted by Toyama (1980) and Sanzol and Herrero (2001).
Bee Flight
For species that require cross-pollination to ensure fruit set, it is essential that environmental conditions favor the activity of vector agents. In this sense, the work of honeybees (Apis mellifera) as pollinators is vital to ensure the transfer of pollen grains from the anthers to the flower stigma.
Bee activity is directly related to climatic variables. A simplification of this directly related dynamic is the agroclimatic indicator of “bee flight,” which corresponds to the sum of hours with temperatures above 15°C and radiation above 300 W/m2, as “optimal flight” conditions.
During the 2023/24 season, conditions were very unfavorable for optimal AV according to optimal flight parameters. Figure 1 shows the differences in weekly bee flight times from the 2020/21 season to the 2023/24 season.
Figure 1. Weekly bee flight times from September to October, 2020 to 2023.
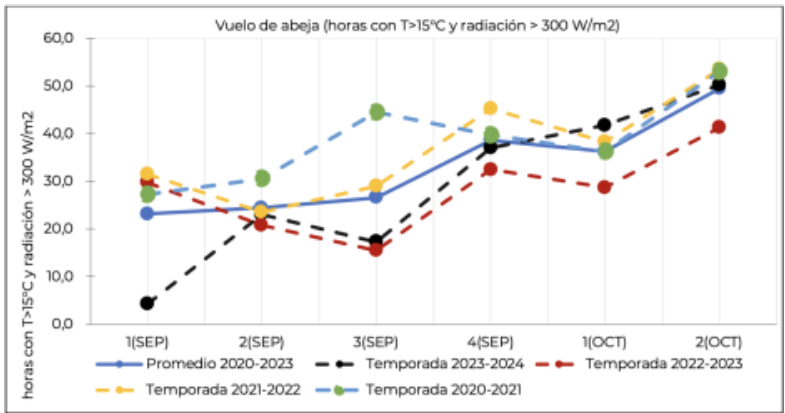
The solid line (blue) represents the average for the 2020 to 2023 seasons. This is close to a standard of 3-4 effective daily flight hours, i.e., 25 hours per week. The graph shows that during the 2023-24 season, weekly bee flight hours were significantly below average in the first week of September, and continued to trend below average throughout the month. This largely explains the drop in yields experienced by early-flowering varieties located in early-harvest areas.
It is important to monitor this agroclimatic indicator as a reference for defining strategies to mitigate the negative effects of a drop in flight hours. Although it is difficult to predict their future behavior, it should be considered that with forecasts of precipitation and/or low temperatures, conditions may not be optimal for bee flight during the flowering period. In this context, the correct positioning of hives, favoring exposure to solar radiation, reducing the impact of direct wind on the entrance, and preventing heat loss from the boxes to the ground, plays a fundamental role.
References:
– Sagredo, K. X., Cassasa, V., Vera, R., & Carroza, I. (2013, June). Pollination and fruit set for ‘Kordia’ and ‘Regina’ sweet cherry trees in southern Chile. In VII International Cherry Symposium 1161 (pp. 353–360).
– Sanzol, J., & Herrero, M. (2001). The “effective pollination period” in fruit trees. Scientia Horticulturae (Amsterdam), 90, 1–17.
– Toyama, T.K. 1980. The pollen receptivity period and its relationship to fruit setting in the stone fruits. Fruits Varieties Journal, 34, 2-4.
– Williams, R.R. (1965). The effect of summer nitrogen applications on the quality of apple blossom. J. Hortic. Sci. 40 (1), 31–41 http://dx.doi.org/10.1080/00221589.1965.11514118.