In the current agronomic field, concepts that generate confusion are circulating. Terms such as precision agriculture, digital agriculture, and the numbered phases of Agriculture 2.0, 3.0, and 4.0, etc., have become prominent in technical discussions.
Even the numbering of Agriculture 1.0 refers to the beginnings of agriculture with the invention of the plow. From the industrial era onward, the numbering is 2.0, with the advent of steam engines. We must not forget a kind of Agriculture 2.5 that this nomenclature omits, which would encompass the “green revolution.”
In the 1980s and 90s, the concept of “precision agriculture” began to be used, focusing on the study of spatial and temporal variability. That is, how key variables behave when moving from one location to another and from one date to another. This led to the popularization of the typical “maps” with which we are familiar in agriculture today. Up to this point, we speak of “Agriculture 3.0.”
We apply precision agriculture when we characterize and quantify spatial variability within a field to guide differentiated management decisions. For example, the use of electromagnetic inductance sensors allows us to map soil before establishing a project, while spectral indices such as NDVI (among others) provide information on vigor and canopy volume (vegetative expression) over time. The objective is not “mapping for the sake of mapping,” but rather to delineate relatively homogeneous units in terms of productivity and/or agronomic response.
These units, defined based on spatial variability and its agronomic interpretation, are known as management zones and form the basis for adjusting practices such as irrigation, fertilization, stocking rate management, and sampling. It is important to develop indicators and monitor them across seasons to observe the evolution of spatial variability and its implications for yield potential.
We are applying precision agriculture, for example, when we use an electromagnetic inductance sensor to map soil before establishing a project, NDVI maps, or other types of mapping that allow us to identify “zones.” The key lies here: identifying zones based on spatial variability that allow us to make informed decisions, which in precision agriculture are known as “management zones.”
The so-called “Agriculture 4.0” has been consolidating in recent years due to a sustained increase in data availability and the capacity to capture it continuously and at different scales. In fruit growing, this translates into the integration of weather stations, irrigation probes, flow meters, and controllers, along with satellite and low-altitude (UAV) remote sensing, agricultural management platforms, crop scouting data, and, increasingly, artificial intelligence tools.
The challenge is no longer simply “having more technology” but rather transforming that volume of information into consistent, traceable, and timely operational criteria to support decision-making, with a solid technical foundation and practical operational application.
With the adoption of generative AI, workflows continue to be organized in stages (acquisition, preprocessing, analysis, and reporting), but automation is advancing rapidly. Today, it is possible to be more efficient by automating tasks such as data analysis, recording, and standardization, and by implementing assistants that query and summarize large volumes of integrated data from irrigation probes, flow meters, controllers, and weather stations, among other sources.
Within this same framework, dashboards, which already represent a significant leap forward in visualizing and exploring key indicators, can be complemented with agents that respond in natural language with the same information typically obtained by filtering the dashboard (for example, by field, date, variety, or water status), provided there is a clear definition of metrics, dimensions, and access rules.
In practice, remote sensing is generally performed using satellites and, at lower altitudes, drones, small planes, or other aerial vehicles (manned or unmanned). Remote sensing requires a platform (satellite, drone, etc.) and a sensor, which allows for image acquisition. These images must have appropriate spatial referencing (georeferencing and, when applicable, orthorectification) for subsequent processing and analysis.
The data for analysis comes from two types of sensors: “passive” and “active”:
• Passive sensors: Capture reflected energy (reflectance or emissivity). Examples: RGB, multispectral, thermal, or hyperspectral cameras.
• Active sensors: Emit energy and quantify its “rebound.” Examples: LiDAR, SAR (Synthetic Aperture Radar), among others.
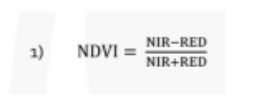
To construct the NDVI index, it is necessary to quantify the reflectance in the red (RED, typically around 630–690 nm) and near-infrared (NIR, typically around 760–900 nm) bands, according to the bands defined by the sensor used. For this, the platform must have a multispectral sensor/camera that includes these bands.
Equation 1 presents the calculation of the NDVI (normalized difference vegetation index), which varies between −1 and 1 and is associated with the greenness and vigor of the canopy.
In precision agriculture, a classic practice is the identification of “homogeneous management zones.” Zoning can be performed using georeferenced data. Anything measurable can be spatially mapped to study its variability. However, in addition to georeferencing, it is necessary to ensure representative and consistent data capture for subsequent analysis.
In the case of remote sensing, images must be georeferenced. These images are composed of pixels, and each pixel records a numerical value associated with the spectral response of the observed object (for example, DN or reflectance, depending on the level of processing). In short, it can be interpreted as if each pixel represents a point observation of the area it covers.
The NDVI index uses the NIR band of the electromagnetic spectrum, whose reflectance tends to increase in active vegetation due to the internal structure of the leaves. However, the NDVI does not depend solely on the NIR band, but also on its contrast with the red band. Therefore, higher NDVI values are generally associated with greater vigor, vegetation cover, or overall vegetative expression.
Figure 2 below presents a practical example of zoning based on satellite images with a spatial resolution of 10 m x 10 m, equivalent to 100 pixels per hectare. In this case, a classification algorithm was applied to segment the NDVI index into ranges from lowest to highest vegetative expression.
In the left zone, plants with lower vegetative expression predominate, representing approximately 30.3% of the surface area, while in the right zone, those with higher vegetative expression predominate, representing approximately 36%. This area exhibits a relative classification associated with a coefficient of variation (CV) of 11% in the NDVI, suggesting moderate spatial variability and a contrast that, in this case, is easily recognizable visually in the field. In most scenarios, it is possible to define management strategies aimed at reducing variability and homogenizing the expression of the vegetation toward the desired objective, according to each particular context. This is where technical criteria become important when making decisions.
Figure 2. Zoning based on the NDVI vegetation index.
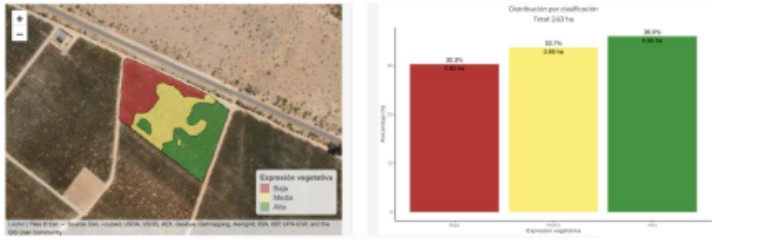
Source: Avium, 2026. Internal image processing.
It is crucial to understand that, in this type of relative analysis, green does not necessarily represent “the best” and red does not necessarily represent “the worst.”
Therefore, these results must be complemented with a technical review in the field to identify the cause of the variability and define which condition (or “typical plant”) is desired from a production standpoint.
This type of analysis helps support decisions regarding practices such as differentiated pruning or thinning, site-specific applications, irrigation management, fertilization, and others.
When using these tools for zoning in cherry cultivation, it is key to consider the following four points:
1. Conduct the analysis on key dates: The analysis should be performed when vegetative expression is stable. This occurs once vegetative growth stops, after the summer solstice (December 21st) and before the start of summer pruning that could introduce noise into the analysis.
2. Properly define the areas to be analyzed: A “ceteris paribus” analysis must be performed. This means blocking out other sources of variability, such as variety, training system, rootstock, planting year, among others, which will generate noise when analyzing the images.
3. Conduct a technical analysis of the images in the field: The images must be accompanied by a field analysis, identifying the root of the problem and evaluating whether the differences in vegetative expression qualify, from a technical-operational point of view, for site-specific management practices that contribute to a homogeneous and balanced plot, according to its productive potential. The defined management practices must be simple to implement and impactful; otherwise, they are not justified.
4. Monitoring the evolution of vegetative expression: The evolution of this variability can be monitored season after season using the same remote sensing techniques (NDVI), as well as simultaneously with other key auxiliary variables measured specifically for each area, such as bud fertility analysis, fruit center counts, reserves, annual shoot length, etc.
Previously, only the practical application of multispectral images was described. However, this is not the only type of data used in remote sensing. For example, plant detection and counting can be performed using RGB images. Thermal images can be used to estimate stress indicators, particularly water stress, from canopy temperature and its contrast with ambient temperature. Hyperspectral images allow for detailed characterization of the spectral signature. Furthermore, active sensors such as LiDAR are used for high-resolution topography and structural characterization of the canopy. And, in specific applications, bathymetric LiDAR systems exist to estimate depth in bodies of water.
General Impressions
Emerging technologies in agriculture are transforming the way we make decisions. However, it is crucial not to lose sight of how data is captured and validated. Malfunctioning sensors, poorly located weather stations or soil moisture probes, lack of maintenance or calibration, and incomplete records can generate erroneous information that, if used without verification, leads to incorrect decisions. The correct use of these technologies allows for data-informed decision-making with traceable criteria.
The challenge is not only obtaining large amounts of data, but also transforming it into useful information for decision-making. In this process, data analytics tools play a key role by integrating, standardizing, and synthesizing information, allowing us to identify trends and patterns that would otherwise go unnoticed. Proper integration, supported by quality control and traceability, can translate into more efficient and sustainable production systems, with positive impacts for the agricultural sector.